
Price Action Gold Trading Strategy: XAU/USD Guide
Gold is one of the most popular assets in the forex market. It offers strong price moves almost every day, making it attractive to both short-term and swing traders. While many traders depend on indicators, experienced traders often focus on something much simpler: price itself.
That is the idea behind price action trading.
A price action gold trading strategy uses the movement of price to make trading decisions. Instead of waiting for an indicator to confirm a move after it happens, traders study market structure, support and resistance, candlestick behavior, and momentum as they develop.
Price action does not predict where gold will go next. It helps traders understand what buyers and sellers are doing right now. That information can lead to better trade entries, clearer stop-loss placement, and more confidence when managing positions.
In this guide, you'll learn how to trade XAU/USD using price action, how to identify high-probability setups, and how to build a trading plan that works in different market conditions.
What Is Price Action Trading?
Price action trading is the practice of analyzing raw price movement without depending on several indicators.
Every candle reflects the battle between buyers and sellers. When candles are viewed together, they reveal trends, reversals, breakouts, and areas where the market is likely to react.
Price action traders mainly focus on:
- Market structure
- Support and resistance
- Swing highs and swing lows
- Candlestick patterns
- Trend continuation
- Breakouts and false breakouts
The chart already contains the information traders need. The goal is to learn how to read it.
If you are still building your base, read the XAUUSD trading techniques before using price action as your main method.
Why Price Action Works Well for Gold
Gold behaves differently from many currency pairs.
XAU/USD often reacts strongly to:
- US inflation data
- Federal Reserve decisions
- Interest rate expectations
- Employment reports
- Geopolitical events
- Changes in US Dollar strength
These events create sharp moves that can quickly make lagging indicators less useful.
Price action allows traders to react to what the market is doing instead of waiting for an indicator to catch up.
Some of the biggest advantages include:
- Cleaner charts
- Faster decision making
- Better understanding of market sentiment
- Flexible use across every timeframe
- Easy adaptation to trending and ranging markets
The goal is not to remove every indicator forever. It is to let price become the primary source of information.
Ready to Apply This in Live Markets?
Begin With the Higher Timeframe
One mistake many beginners make is opening the five-minute chart and looking for trades immediately.
Professional traders usually begin with the larger picture.
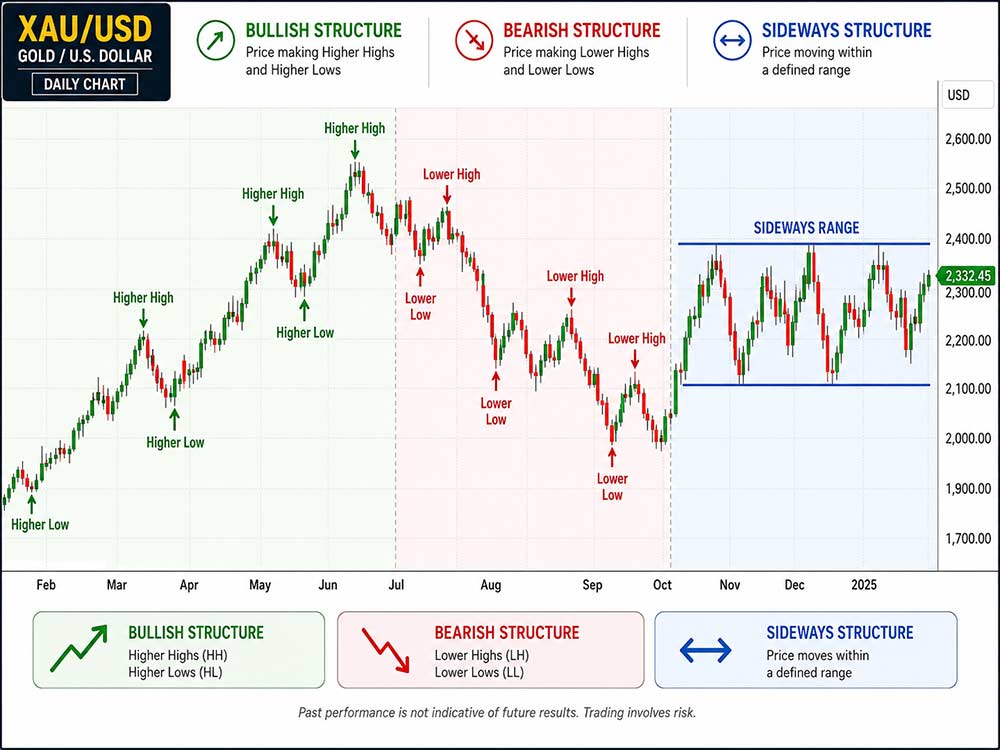
Open the daily chart first.
Ask yourself:
- Is gold making higher highs?
- Is it making higher lows?
- Are lower highs forming?
- Are lower lows forming?
- Is price simply moving sideways?
The answers identify the current market phase.
A bullish market creates higher highs and higher lows.
A bearish market creates lower highs and lower lows.
When neither side controls the market, price usually moves inside a range until a breakout happens.
Starting with the higher timeframe helps avoid trading against the dominant trend.
Begin With the Higher Timeframe
Understand Market Structure
Market structure forms the foundation of every successful price action strategy.
Every swing high and swing low tells part of the story.
Bullish Structure
A bullish market shows:
- Higher highs
- Higher lows
Buyers continue pushing price upward after every pullback.
This is usually the best environment for looking for buying opportunities.
Bearish Structure
A bearish market forms:
- Lower highs
- Lower lows
Sellers remain in control, making selling opportunities more attractive than buying.
Sideways Structure
Sometimes gold simply moves between support and resistance.
Neither buyers nor sellers gain full control.
Many traders lose money trying to force trades inside these ranges.
Patience often pays better than constant trading.
Mark Important Support and Resistance
Support and resistance are where many high-quality trades begin.
Support is an area where buying pressure has previously stopped price from falling.
Resistance is where selling pressure has pushed price lower before.
Instead of drawing dozens of lines, focus on the major levels visible on the daily and four-hour charts.
Strong levels often create:
- Rejections
- Breakouts
- Trend continuation
- Trend reversals
The more often price reacts to a level, the more attention it deserves.
Wait for Price to Reach Your Levels
Finding support and resistance is only the first step.
Many traders enter too early because they become impatient.
Price action trading rewards discipline.
Mark your levels.
Wait for price to reach them.
Only then begin looking for an opportunity.
Professional traders spend much more time waiting than entering trades.
Read Price Rejection
Not every touch of support or resistance creates a trade.
Price needs to show rejection.
Rejection tells you buyers or sellers defended that area.
Common examples include:
- Long lower wicks at support
- Long upper wicks at resistance
- Strong bullish candles after support
- Strong bearish candles after resistance
These candles show one side gained control after testing an important level.
The stronger the rejection, the stronger the message.
Ready to Apply This in Live Markets?
Use Candlestick Confirmation
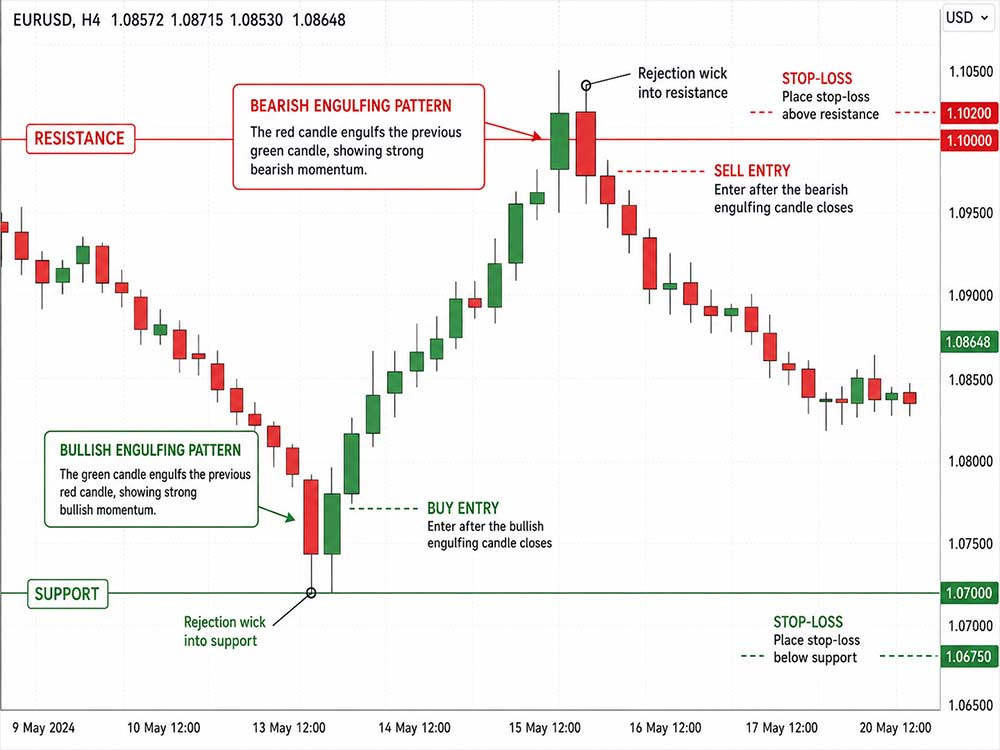
Candlestick patterns should confirm your market idea rather than create it.
Some of the most reliable bullish patterns include:
- Bullish engulfing candle
- Hammer
- Morning star
- Strong bullish rejection candle
For bearish trades, traders often watch for:
- Bearish engulfing candle
- Shooting star
- Evening star
- Strong bearish rejection candle
These patterns become much more reliable when they appear at key support or resistance.
A bullish engulfing candle in the middle of nowhere means very little.
The same pattern appearing after price rejects daily support becomes much more valuable.
Use Candlestick Confirmation
Measure Momentum Through Price Swings
Price action is more than candlesticks.
Study the size of each move.
Large impulsive waves show strong momentum.
Smaller waves suggest momentum is slowing.
For example, imagine gold rallies $40, pulls back only $10, then rallies another $45.
That tells you buyers remain strong.
Now imagine every rally becomes smaller while pullbacks become larger.
Momentum is fading.
This often happens before a reversal or a longer period of consolidation.
Comparing swing size helps traders understand whether the trend remains healthy.
Use Multi-Timeframe Analysis
A good trade usually begins on the higher timeframe and finishes on the lower timeframe.
One simple workflow looks like this:
- Identify the trend on the daily chart.
- Draw major support and resistance.
- Wait for price to reach those levels.
- Move to the four-hour or one-hour chart.
- Look for confirmation before entering.
This keeps traders aligned with the larger trend while improving entry precision.
Watch for Chart Patterns
Price action patterns appear because traders repeatedly react in similar ways.
Some of the most useful bullish patterns include:
- Double bottom
- Triple bottom
- Bullish flag
- Falling wedge
- Ascending triangle
- Inverse head and shoulders
Bearish patterns include:
- Double top
- Triple top
- Bearish flag
- Rising wedge
- Descending triangle
- Head and shoulders
Do not trade every pattern.
Focus on patterns that develop near important support or resistance while matching the higher timeframe trend.
Wait for the Breakout
Many traders enter while the pattern is still forming.
That increases the chance of getting trapped.
Instead, wait for confirmation.
For horizontal patterns like double tops and double bottoms, confirmation comes after the neckline breaks.
For wedges, flags, and triangles, wait until price closes beyond the trendline.
The extra patience often filters out weak setups and reduces false breakouts.
For a deeper setup focused on breakouts, use this XAUUSD breakout strategy as a companion guide.
Plan Every Trade Before You Enter
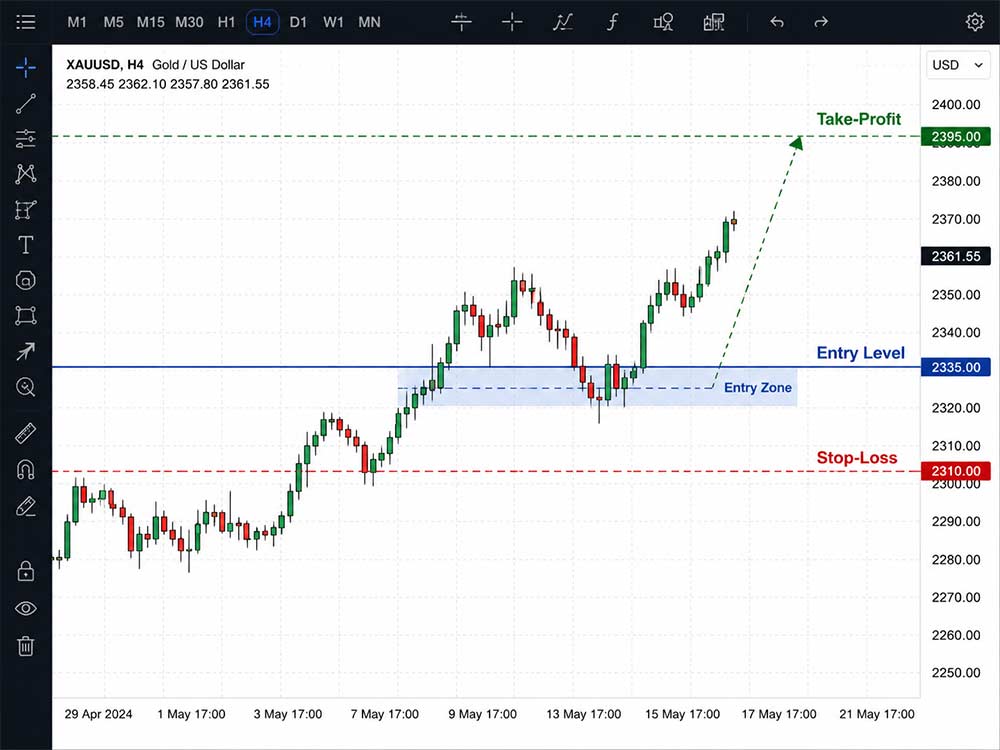
A good setup is only part of the trade. Every position should include a clear plan before you click the buy or sell button.
Decide three things before entering:
- Your entry price.
- Your stop-loss.
- Your profit target.
Never decide these after the trade is open.
Many beginners focus only on finding entries. Professional traders spend just as much time planning exits.
Plan Every Trade Before You Enter
Where to Place Your Stop-Loss
One of the biggest mistakes new traders make is placing stop-loss orders too close to price.
Gold is naturally volatile. Small pullbacks happen even during strong trends.
Your stop-loss should sit beyond the price action that proves your trade idea wrong.
For example:
- A buy trade near support should place the stop below the recent swing low.
- A sell trade near resistance should place the stop above the recent swing high.
This gives the trade enough room to develop while protecting your account if the market changes direction.
Avoid using the same fixed stop-loss on every trade. Let the chart decide where your stop belongs.
Set Realistic Profit Targets
Price action traders often use market structure to find exit points.
Common targets include:
- The next resistance level during buy trades.
- The next support level during sell trades.
- Previous swing highs.
- Previous swing lows.
Some traders also use a fixed risk-to-reward ratio.
A common goal is at least 1:2.
If your stop-loss is $10, your target should aim for at least $20.
Not every trade reaches that target, but maintaining positive risk-to-reward helps profitable traders stay ahead over many trades.
Ready to Apply This in Live Markets?
Manage Risk on Every Trade
Even the best price action strategy will produce losing trades.
That is normal.
Risk management protects your account during those periods.
Some basic rules include:
- Risk only a small percentage of your account per trade.
- Never increase position size after a loss to recover quickly.
- Avoid opening several gold positions that all depend on the same market move.
- Accept losing trades as part of trading.
Consistency comes from protecting capital first.
Without proper risk management, even a strong strategy will eventually fail.
For a full risk checklist, read our XAU/USD risk management guide before increasing position size.
Build a Simple Price Action Trading Routine
Successful traders often follow the same routine every day.
Keeping your process simple removes unnecessary decisions.
A daily checklist could look like this:
Step 1: Check the Daily Trend
Identify whether gold is trending higher, trending lower, or moving sideways.
Step 2: Draw Key Levels
Mark major support and resistance from the daily and four-hour charts.
Avoid filling your chart with too many lines.
Step 3: Wait
Patience is one of the biggest advantages in trading.
There is no reason to force trades between important levels.
Step 4: Look for Confirmation
When price reaches your level, watch the lower timeframe.
Look for:
- Strong rejection candles.
- Bullish or bearish engulfing patterns.
- Breakouts.
- Trend continuation patterns.
Step 5: Plan the Trade
Before entering, identify:
- Entry.
- Stop-loss.
- Profit target.
- Risk-to-reward ratio.
If one of these is unclear, skip the trade.
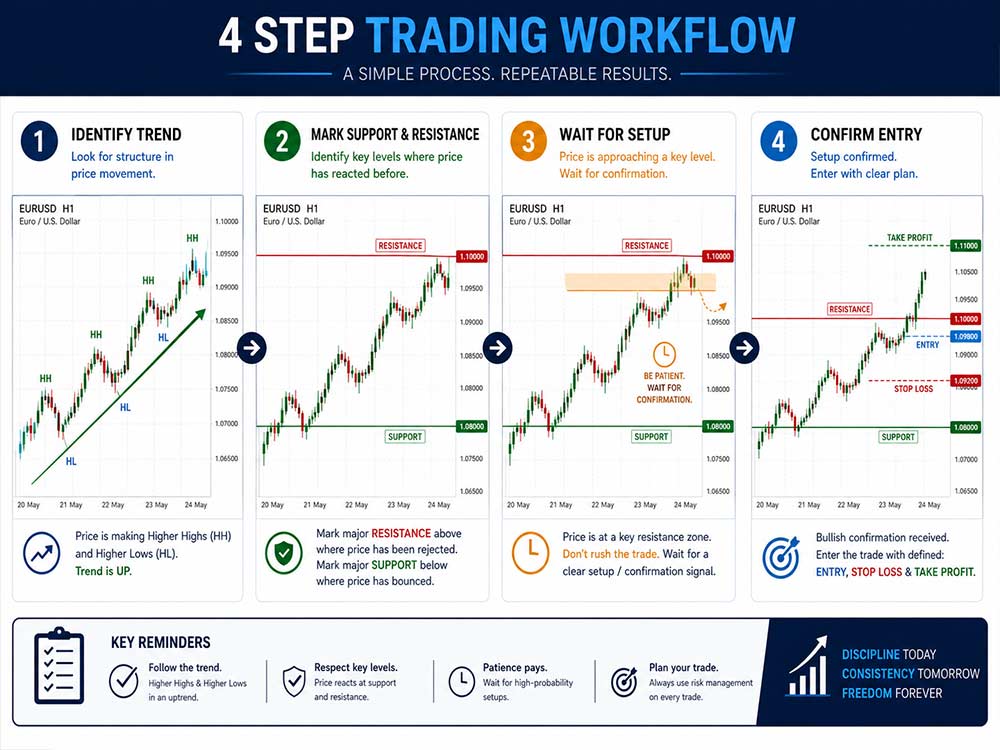
4 Step Trading Workflow
Common Mistakes Price Action Traders Make
Price action looks simple, but many traders make the same mistakes repeatedly.
Trading Against the Trend
Buying during a strong downtrend usually creates unnecessary risk.
Trading with the higher timeframe trend often produces better opportunities.
Ignoring Market Structure
Candlestick patterns alone are not enough.
Always ask where the pattern forms.
A hammer at strong support carries much more weight than a hammer in the middle of a range.
Entering Too Early
Many traders assume support or resistance will hold.
Wait for price to confirm the move first.
Patience often improves both entry quality and risk management.
Drawing Too Many Levels
Charts filled with dozens of lines quickly become confusing.
Focus only on the strongest support and resistance zones that have produced clear reactions.
Overtrading
Gold provides many price movements every day.
That does not mean every move deserves a trade.
Waiting for high-quality setups usually produces better long-term results than taking every possible signal.
This section also connects closely with our guide on gold trading mistakes, which covers the bad habits that hurt many beginner traders.
Best Timeframes for Trading Gold With Price Action
Price action works on every timeframe, but some are more reliable than others.
The Daily chart works well for identifying the main trend.
The 4-hour chart helps locate support, resistance, and swing points.
The 1-hour chart is useful for finding entries after confirmation.
Lower timeframes like the 5-minute or 15-minute chart can be used for active day trading, but they also contain more market noise and false signals.
Many traders combine the Daily, 4H, and 1H charts to build a complete trading plan.
Session timing can also change how price action behaves. This London Session Gold Trading Strategy guide is a useful next step for traders who want a session-based gold plan.
Example of a Price Action Gold Trade
Imagine gold is trending higher on the daily chart.
Price pulls back toward a major support level that has held several times in the past.
Instead of buying immediately, you wait.
On the one-hour chart, price forms a bullish engulfing candle with a long lower wick after rejecting support.
A few candles later, price breaks above a small falling wedge.
The trade plan becomes clear.
- Entry after the breakout candle closes.
- Stop-loss below the recent swing low.
- Take-profit near the previous daily high.
Every part of the trade follows the same process:
- Trend first.
- Key level.
- Rejection.
- Confirmation.
- Risk management.
No indicators were needed.
The chart itself provided every clue.
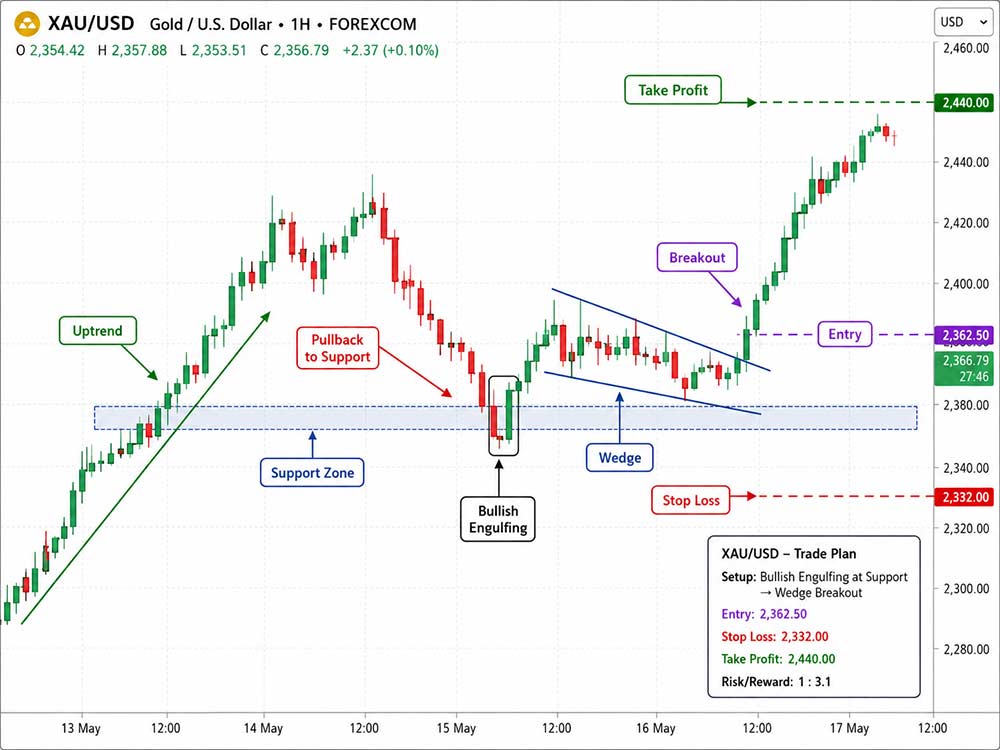
Example of a Price Action Gold Trade
Is Price Action Enough to Trade Gold?
For many traders, yes.
Price action already includes everything the market has done.
Some traders choose to combine it with one or two simple tools like a moving average or volume indicator.
Others prefer completely clean charts.
Neither approach is automatically better.
The important point is that indicators should support your analysis, not replace it.
Learning to read price first creates a stronger foundation regardless of which tools you later decide to add.
Ready to Apply This in Live Markets?
Final Thoughts
A price action gold trading strategy is built on simplicity.
Instead of filling charts with indicators, focus on understanding how price moves.
Start with the higher timeframe.
Identify the market trend.
Mark important support and resistance levels.
Wait for price to reach those areas before looking for confirmation.
Use candlestick patterns and chart formations to support your analysis instead of making them the entire strategy.
Most importantly, manage risk on every trade.
No strategy wins every time, but disciplined traders understand that consistency comes from following the same process over and over again.
While your strategy matters, the trading environment you use also plays a role. Trading platforms like Dominion Markets can support price action traders with tight spreads on gold, fast execution, and minimal chart clutter, which helps you focus purely on reading price without unnecessary distractions.
With enough practice, price action becomes less about predicting the market and more about reacting to what XAU/USD is already telling you.
Frequently Asked Questions
1. What is the best price action strategy for gold?
There is no single best strategy. Many traders combine market structure, support and resistance, candlestick confirmation, and breakout trading while following the higher timeframe trend.
2. Which timeframe is best for trading XAU/USD with price action?
The Daily chart is useful for identifying the trend, while the 4-hour and 1-hour charts are commonly used to find trade entries.
3. Do I need indicators to trade gold?
No. Many traders use only price action. Others combine it with one or two indicators for extra confirmation.
4. Is price action good for beginners?
Yes. Learning market structure, support and resistance, and candlestick behavior gives beginners a strong foundation before using more advanced trading tools.
5. How do I avoid false breakouts?
Wait for candles to close beyond important levels instead of entering during the breakout. Combining higher timeframe analysis with lower timeframe confirmation can also reduce false signals.
Ready to Apply This in Live Markets?


